Sudden 100% CPU usage causing non responsive chat till service restart

Since a few days Rocket Chat is using 100% CPU from time to time. It stays using 100% till I restart the service. During that 100% CPU usage the entire chat becomes unresponsive.

First I thought it was related to the API usage for setting / uploading avatars to RC however I disabled this flow and the issue remains. The only thing that did change over the past days is the upgrade from 0.71 to 0.72, Yesterday I upgraded to 0.72.1 however the problem remains.

Going trough the changelog of 0.72 I don’t see anything that might cause this 100% CPU usage in our case. It also doesn’t happen on the same hour of day.

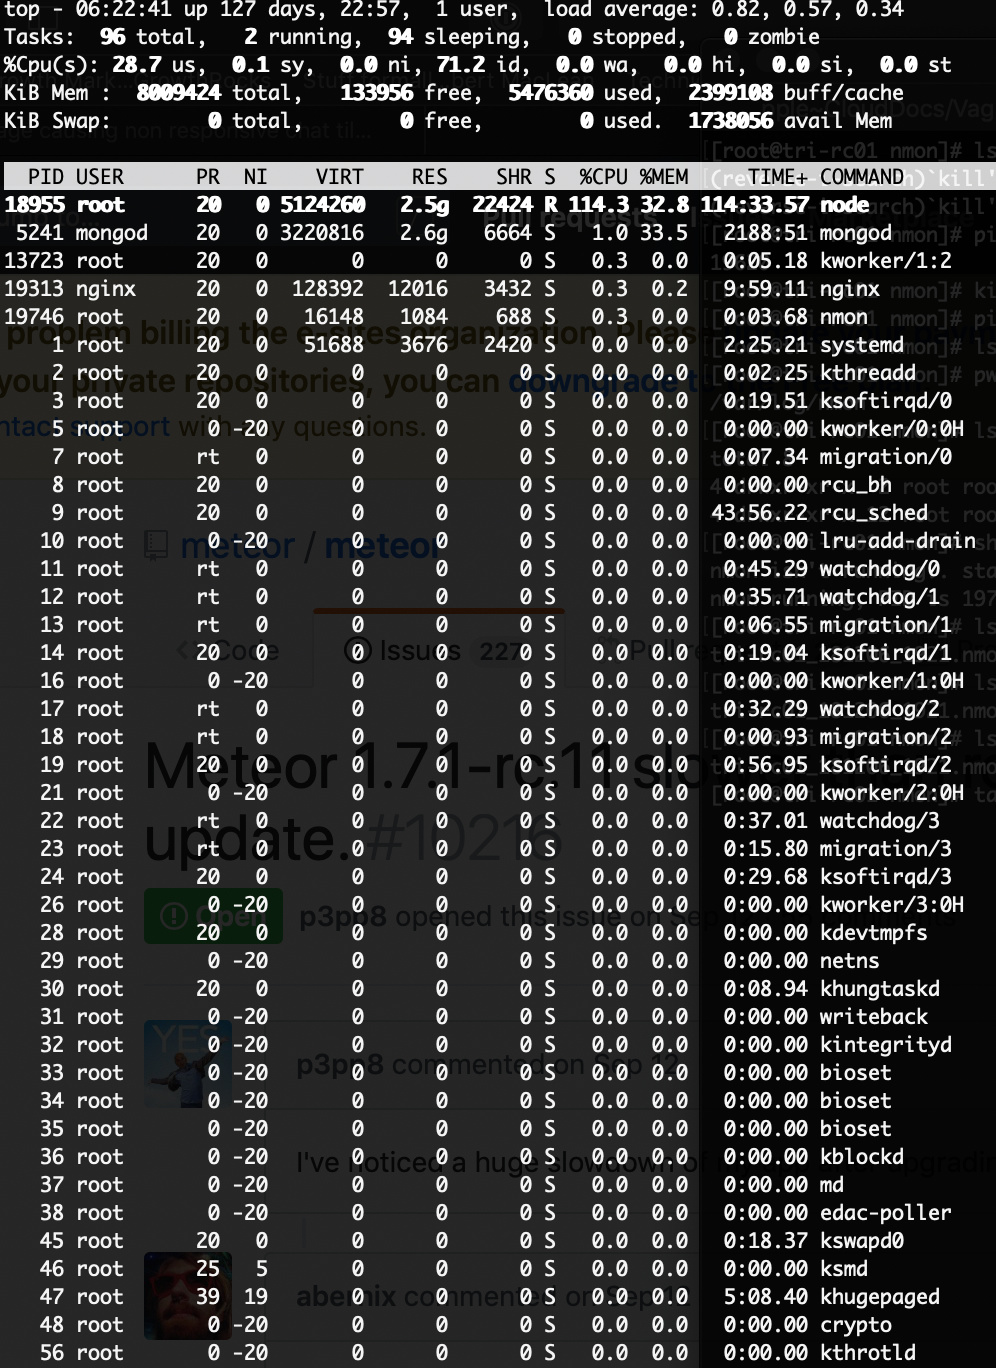
Below two screenshots of the CPU spike that stays on till I restart the process.

Screenshot1:

Screenshot2:

Logs
I don’t see anything that jumps out of the logs that wasn’t there earlier. I do log exceptions swell now to a RC channel but the errors don’t align time wise with the outages.

Exceptions:

Exception in added observe/observeChanges callback:
TypeError: Cannot destructure property `username` of 'undefined' or 'null'.

BulkWriteError: E11000 duplicate key error collection: 
rocketchat.rocketchat_message index: _id_ dup key: { : "G9oJAbj6iYRqHxLjo" }

Log:

Dec  3 04:01:01 tri-rc01 systemd: Removed slice User Slice of root.
Dec  3 04:01:01 tri-rc01 systemd: Stopping User Slice of root.
Dec  3 04:01:01 tri-rc01 systemd: Created slice User Slice of root.
Dec  3 04:01:01 tri-rc01 systemd: Starting User Slice of root.
Dec  3 04:01:01 tri-rc01 systemd: Started Session 3238 of user root.
Dec  3 04:01:01 tri-rc01 systemd: Starting Session 3238 of user root.
Dec  3 04:01:01 tri-rc01 systemd: Removed slice User Slice of root.
Dec  3 04:01:01 tri-rc01 systemd: Stopping User Slice of root.
Dec  3 04:09:20 tri-rc01 rocketchat: The endpoint "permissions" is deprecated and will be removed after version v0.69
Dec  3 04:15:08 tri-rc01 rocketchat: TypeError: Cannot read property 'getRedirectURL' of undefined
Dec  3 04:15:08 tri-rc01 rocketchat: at FileUploadClass.copy (/opt/Rocket.Chat/programs/server/packages/rocketchat_file-upload.js:1008:30)
Dec  3 04:15:08 tri-rc01 rocketchat: at Object.copy (/opt/Rocket.Chat/programs/server/packages/rocketchat_file-upload.js:627:13)
Dec  3 04:15:08 tri-rc01 rocketchat: at copyFile (/opt/Rocket.Chat/programs/server/packages/rocketchat_user-data-download.js:272:20)
Dec  3 04:15:08 tri-rc01 rocketchat: at exportOperation.fileList.forEach.attachmentData (/opt/Rocket.Chat/programs/server/packages/rocketchat_user-data-download.js:536:9)
Dec  3 04:15:08 tri-rc01 rocketchat: at Array.forEach (<anonymous>:null:null)
Dec  3 04:15:08 tri-rc01 rocketchat: at continueExportOperation (/opt/Rocket.Chat/programs/server/packages/rocketchat_user-data-download.js:535:32)
Dec  3 04:15:08 tri-rc01 rocketchat: at cursor.forEach.exportOperation (/opt/Rocket.Chat/programs/server/packages/rocketchat_user-data-download.js:577:5)
Dec  3 04:15:08 tri-rc01 rocketchat: at SynchronousCursor.forEach (/opt/Rocket.Chat/programs/server/packages/mongo.js:1120:16)
Dec  3 04:15:08 tri-rc01 rocketchat: at Cursor.(anonymous function) [as forEach] (/opt/Rocket.Chat/programs/server/packages/mongo.js:918:44)
Dec  3 04:15:08 tri-rc01 rocketchat: at Object.processDataDownloads [as job] (/opt/Rocket.Chat/programs/server/packages/rocketchat_user-data-download.js:572:10)
Dec  3 04:15:08 tri-rc01 rocketchat: at packages/littledata_synced-cron.js:251:26
Dec  3 04:15:08 tri-rc01 rocketchat: at scheduleTimeout (packages/littledata_synced-cron.js:304:9)
Dec  3 04:15:08 tri-rc01 rocketchat: at packages/littledata_synced-cron.js:356:42
Dec  3 04:15:08 tri-rc01 rocketchat: at Meteor.EnvironmentVariable.EVp.withValue     (packages/meteor.js:1304:12)
Dec  3 04:15:08 tri-rc01 rocketchat: at packages/meteor.js:620:25
Dec  3 04:15:08 tri-rc01 rocketchat: at runWithEnvironment (packages/meteor.js:1356:24)
Dec  3 04:25:10 tri-rc01 rocketchat: The endpoint "permissions" is deprecated and will be removed after     version v0.69

Setup and server information:
type: VPS, only running RC and MongoDB
CPU: 4 core
RAM: 8GB
Number of users online: 50-300
Operating System: CentOS Linux release 7.6.1810
Version of Rocket.Chat Server: 0.72.1
Deployment Method: tar
Number of Running Instances: 1
Oplog: disabled
NodeJS Version: 8.12.0
MongoDB Version: v3.2.21
Node Version: v8.11.4

Hello!

It’s interesting that we can see a spike in I/O and network activity at the same time CPU usage increases. Do you have a top output from that time so we can see the processes involved during that time? If not, it might be a good thing to have next time a CPU spike happens.

Additionally, do you have any recurring, scheduled job that might impact server performance at the time of the spikes?

Today we have set up nmon so we can log some more data. “Luckily” we didn’t have to wait long and I was able to make two screenshots after each other of nmon in interactive mode just now when it happened.

Next time I will make a screenshot of top and have additional information from nmon if everything goes well. But maybe the screenshots above already help a bit.

I just needed to restart the service again. Below are the screenshots requested. I also asked help from one or our members and he thought this might be related:


Two screenshots of top when it just happened again:

Screenshot 1:

Screenshot 2:

NMON screenshot:

There are no recurring, scheduled jobs around the time of the spikes

Can you look at your mongo logs and see if there are logs about long queries around that time? It’s possible a query or set of queries is some how blocking and causing Rocket.Chat side to spike.

If you don’t have mongo piping to syslog mongo logs should be at /var/log/mongodb.log (name might be slightly different. Don’t have PC at hand to check)

Most of the time queries longer then 200ms are logged

Queries that are logged:

This one I see occur the most:
2018-12-07T21:16:01.928+0000 I COMMAND [conn72] command rocketchat.rocketchat_message command: count { count: “rocketchat_message”, query: { _hidden: { $ne: true }, rid: “cwJ7WBJKbfSLZY89C”, ts: { $gt: new Date(1521725899059), $lt: new Date(1544202188085) }, t: { $nin: [ “uj”, “ul”, “ru”, “au”, “user-muted”, “user-unmuted” ] } } } planSummary: IXSCAN { rid: 1, ts: 1 } keyUpdates:0 writeConflicts:0 numYields:374 reslen:62 locks:{ Global: { acquireCount: { r: 750 } }, Database: { acquireCount: { r: 375 } }, Collection: { acquireCount: { r: 375 } } } protocol:op_query 196ms

2018-12-07T17:41:58.790+0000 I WRITE    [conn67] warning: log line attempted (25kB) over max size (10kB), printing beginning and end ... update rocketchat.rocketchat_message query: { _id: { $in: [ "j8BKsAmPipjMkNxZy", "ziuSRhZ3bGTrLbywi", "Ee3ovi5wTbGvLSYBN", "L37qQqGB9F6YRsQKY", "hzp7PTtxbcD2HQauS", "hLRwQ9EEjCd6GWr4F", "WRZpQ4ysFFJj33CDK", "K4L88Ahqrmx3HFeMy", "mff6MdnPQ7Wo56Qdq", "zwvFszydiQ3sPnNKq", "nMkKA7ranNhaF5RJX", "8wh43XddT3iPcheRm", "Z5cPeMHuuhFopjE47", "r6qZEiGZR74dMrrsn", "KRumMq9T7sPFPhdi3", "gPQXEMpF6QJjyGFig", "WFit7g9gdvyW2GTx5", "wHv8vDWp7Tn7YmLgS", "EvHhyx75985j6Wy2iT", "L4tyLuhGPOLgyvaC8q", "egz3OwPlrDM7mhPdX4", "4TNzG7qpSay6AN3vz", "mWoSew

I attached the log since 2018-11-30 here:

ps for others looking for the log my path was /var/log/mongodb/mongod.log

What time did cpu spike in relation to logs?

Do you have any message retention settings enabled?

I was waiting for a new downtime and it just happend again. In the same minute as this occurred in the monolog file:

2018-12-08T10:39:36.529+0000 I COMMAND  [conn74] command rocketchat.rocketchat_message command: count { count: "rocketchat_message", query: { _hidden: { $ne: true }, rid: "cwJ7WBJKbfSLZY89C", ts: { $gt: new Date(1533390937636), $lt: new Date(1544211853354) }, t: { $nin: [ "uj", "ul", "ru", "au", "user-muted", "user-unmuted" ] } } } planSummary: IXSCAN { rid: 1, ts: 1 } keyUpdates:0 writeConflicts:0 numYields:356 reslen:62 locks:{ Global: { acquireCount: { r: 714 } }, Database: { acquireCount: { r: 357 } }, Collection: { acquireCount: { r: 357 } } } protocol:op_que

Retention policy is disable completely.

Edit: I just checked the room ID and this is our biggest channel by far in terms of activity. When I execute the logged query manually the result for this room is 45294.

Was there a flurry of queries like this prior? Or any queries in general? During this time is mongo responsive? As in can you hop in and query?

This is interesting that it’s your biggest channel… how many people are in that biggest channel?

Yes, I just went back to examine older log files but that query isn’t new and is occurring for at least 6 months now as it turns out. I tried running the query multiple times right after each other manually myself without any issues trough Robo3T.

There are 778 users in total but definitely not all are active. When someone registers on our site he/she automatically gets access to this channel.

I now have a script in place that monitors the load of node and restarts rocket chat if the load is above a certain threshold for a certain of minutes but this is merely a workaround off-course.

thanks @langezwieper for the very detailed responses.

looking at the slow query, it seems to be the “load channel history” action, and even with that many records, it should not be a slow operation (it’s not the slowest we usually see).

from the top commands you sent the screenshots, I saw you’re running MongoDB along with Rocket.Chat, on same server, I’d suggest you to move it to separate server, as they might be fighting for same resources so they might be locking each other. Please make sure to follow MongoDB production notes:

https://docs.mongodb.com/manual/administration/production-notes/
https://docs.mongodb.com/manual/administration/production-checklist-operations/

Can you please also run the following command on your database and share the results? Please, remove any sensitive data:

db.rocketchat_settings.find().forEach(function(s) {
    if (!s._id.match(/^Assets/) && !s._id.match(/^Layout/) && s._id !== 'css' && s.value !== s.packageValue) {
        print(s._id + ' - ' + s.value);
    }
});

this will tell us what the configurations you have changed, so we can understand better how rocket.chat should be behaving.

1 Like

Thank you, trying to be as clear as possible in order to get to a solution.

It’s correct the MongoDB is running on the same server as RocketChat. Thank you for the suggestion I will be moving it in the coming weeks hoping that will resolve the issue.

Below is the output of the query:

uniqueID - *REMOVED*
Accounts_AllowUserProfileChange - false
Accounts_AllowUserAvatarChange - false
Accounts_AllowRealNameChange - false
Accounts_AllowUsernameChange - false
Accounts_AllowEmailChange - false
Accounts_LoginExpiration - 120
Accounts_SearchFields - username, name, emails.address
Accounts_RequireNameForSignUp - false
Accounts_RequirePasswordConfirmation - false
Accounts_RegistrationForm - Disabled
Accounts_RegistrationForm_SecretURL - *REMOVED*
Accounts_PasswordReset - false
Accounts_Default_User_Preferences_emailNotificationMode - nothing
Accounts_SetDefaultAvatar - false
Show_Setup_Wizard - completed
Site_Url - https://chat.*REMOVED*.com
Site_Name - *REMOVED*
Language - en
First_Channel_After_Login - lounge
Direct_Reply_Port - 143
SMTP_IgnoreTLS - false
SMTP_Pool - false
Message_AllowDeleting_BlockDeleteInMinutes - 5
Message_ShowDeletedStatus - true
Message_HideType_uj - true
Message_HideType_ul - true
Message_HideType_ru - true
Message_HideType_au - true
Message_HideType_mute_unmute - true
Organization_Type - community
Organization_Name - *REMOVED*
Industry - socialNetwork
Size - 0
Country - unitedStates
Website - https://www.*REMOVED*.com
Server_Type - privateTeam
theme-custom-css - .rc-alerts.rc-alerts--large {
  display: none;
}
GoogleAnalytics_enabled - true
GoogleAnalytics_ID - UA-*REMOVED*-1
Log_Exceptions_to_Channel - development
FileUpload_MaxFileSize - 8812152
FileUpload_MediaTypeWhiteList - image/*,audio/*,video/*,application/zip,application/x-rar-compressed,application/pdf,text/plain,application/msword,application/vnd.openxmlformats-officedocument.wordprocessingml.document,application/vnd.openxmlformats-officedocument.spreadsheetml.sheet,text/x-yaml,text/yaml
WebRTC_Enable_Private - true
WebRTC_Enable_Direct - true
Accounts_iframe_enabled - true
Accounts_iframe_url - https://www.*REMOVED*.com/login
Accounts_Iframe_api_url - https://www.*REMOVED*.com/rc/auth
IRC_Host - irc.freenode.net
Prometheus_Port - 9100
RetentionPolicy_Enabled - true
RetentionPolicy_Precision - 1
RetentionPolicy_AppliesToChannels - true
RetentionPolicy_MaxAge_Channels - 180
RetentionPolicy_ExcludePinned - true

FWIW I’m experiencing the same problem. Rocket.chat installation with about 100 users, about 140 channels/private groups. MongoDB is running on the same host as RC, both dockerized. Until some time in November (?) this was not a problem at all.

Now we’re seeing increased CPU usage, that eventually spikes to 100%, people experience lag, in some cases they even get disconnected, and eventually RC stops responding and I have to restart the container. This happens between every day to every 3 days now. Nothing interesting in the log.

@HrHansen we saw the same symptoms during the last few weeks. System was ok-ish after a restart but became slow after a few hours to the point clients disconnected, with ~130 users. The node thread took 100% CPU. Mongo as a container, Rocket as another container, both on the same host (actually a VM).

This morning we’ve finally configured for oplogs, seems this is the recommendation for Meteor apps. Even with only one DB instance it dramatically reduces node’s CPU usage. I’m somewhat positive this makes a difference. I’d love to hear your results.

This definitely makes some sense. Oplog is used to propagate information to Rocket.Chat. If that’s not present Rocket.Chat has to poll the db more frequently to look for changes.

@aaron.ogle

Any further details on this? I encountered this problem recently that the channels app response goes very bad (slow) and after couple of hours it gets normal. This is not so frequent now, but once in a while.

Concurrent User: 800-900
The app response time spikes from 500ms to 3000ms+.
Max cpu consumption and expensive db query.

We tried using single primary mongo server for every read and write operation to make sure there is no problem with scalability.

TypeError: Cannot read property 't' of undefined
at MethodInvocation.leaveRoom (/home/deploy/rocketchat/releases/20181030073728/bundle/programs/server/packages/rocketchat_lib.js:16829:14)
at MethodInvocation.methodsMap.(anonymous function) (/home/deploy/rocketchat/releases/20181030073728/bundle/programs/server/packages/rocketchat_lib.js:2506:36)
at MethodInvocation.methodMap.(anonymous function) (packages/rocketchat_monitoring.js:2731:30)
at maybeAuditArgumentChecks (/home/deploy/rocketchat/releases/20181030073728/bundle/programs/server/packages/ddp-server.js:1877:12)
at DDP._CurrentMethodInvocation.withValue (/home/deploy/rocketchat/releases/20181030073728/bundle/programs/server/packages/ddp-server.js:902:126)
at Meteor.EnvironmentVariable.EVp.withValue (packages/meteor.js:1186:12)
at DDPServer._CurrentWriteFence.withValue (/home/deploy/rocketchat/releases/20181030073728/bundle/programs/server/packages/ddp-server.js:902:98)
at Meteor.EnvironmentVariable.EVp.withValue (packages/meteor.js:1186:12)
at Promise (/home/deploy/rocketchat/releases/20181030073728/bundle/programs/server/packages/ddp-server.js:902:46)
at new Promise (<anonymous>:null:null)
at Session.method (/home/deploy/rocketchat/releases/20181030073728/bundle/programs/server/packages/ddp-server.js:875:23)
at /home/deploy/rocketchat/releases/20181030073728/bundle/programs/server/packages/ddp-server.js:754:85

Ok, sorry for the delay. Today I enabled OpLog for this server instance, and so far it looks very promising. The over all loadavg of the host hasn’t really changed, but the nodejs process is using less CPU and it looks like the bad spikes are gone. Thanks a bunch for pointing me in the right direction! :smiley:

Green line is the CPU usage of the rocket.chat container, OpLog enabled at 14:20:

image

1 Like

@a5his how many instances of Rocket.Chat? What does your mongo connection string look like?

At max we have 11 app instances (autoscaling enabled) running and they have 30 secs of sticky session for persistent connection.

Below is how Mongo Url looks like

MONGODB_HOSTS="mongo4:27017,mongo5:27017,mongo3:27017,mongo6:27017,mongo7:27017"
export MONGO_OPLOG_URL="mongodb://$MONGODB_HOSTS/local?replicaSet=$REPLICA_SET&authSource=admin"
export MONGO_URL="mongodb://$MONGODB_HOSTS/parties?replicaSet=$REPLICA_SET&readPreference=primary&w=majority"

Having the same issue. I know this sort of comment isn’t helpful but heres my setup.

I have 5 mongo DB servers in containers, 4 RC servers in containers also.
OPLOGS enabled

In the last few months, we have been going to 100% CPU and becoming unavailable. about 900 users (mostly created via slackbridge) and about 50 locally.
The time of the query is very large.

I went back from 0.71.0 to 0.70.4 to see if it was related but hasn’t fixed anything.

MongoDB shows a query like
2019-01-30T04:45:13.617+0000 I WRITE [conn36] update meteor.users command: { q: { _id: “redacted” }, u: { $set: { lastLogin: new Date(1548823256806), _updatedAt: new Date(1548823256806) } }, multi: false, upsert: false } planSummary: IDHACK keysExamined:1 docsExamined:1 nMatched:1 nModified:1 keysInserted:2 keysDeleted:2 writeConflicts:15 numYields:16 locks:{ Global: { acquireCount: { r: 18, w: 18 } }, Database: { acquireCount: { w: 18 }, acquireWaitCount: { w: 1 }, timeAcquiringMicros: { w: 4264579 } }, Collection: { acquireCount: { w: 17 } }, oplog: { acquireCount: { w: 1 } } } 256015ms

EDIT: This is running on a 4 CPU server with 64GB ram all on SSD. The reason for so many RC containers running is other threads recommended it to get around the threading issues with node.js etc. Mongo wants an odd number and shares reads so i thought 5 of them would be helpful.